Introduction to Trading View and Its Core Features
In today’s fast-paced financial markets, having access to real-time data, advanced charting tools, and a vibrant community can make a significant difference in a trader’s success. This is where trading view enters the scene as a comprehensive platform that caters to both novice and professional traders. Recognized for its powerful charting capabilities, wide asset coverage, and social features, Trading View has established itself as a go-to resource for market analysis across the globe.
At its core, Trading View offers an intuitive interface combined with sophisticated tools that facilitate technical analysis. Whether you are tracking stocks, cryptocurrencies, forex, or commodities, the platform’s versatility allows traders to monitor multiple markets simultaneously, customize their workspace to fit personal preferences, and leverage a vast library of technical indicators and drawing tools. Its social network aspect promotes idea sharing, helping traders learn from each other’s insights and trade ideas, thereby fostering a collaborative environment for continuous learning and growth.
Setting Up Your Trading View Account and Customizing Your Workspace
Creating an Effective Trading Dashboard
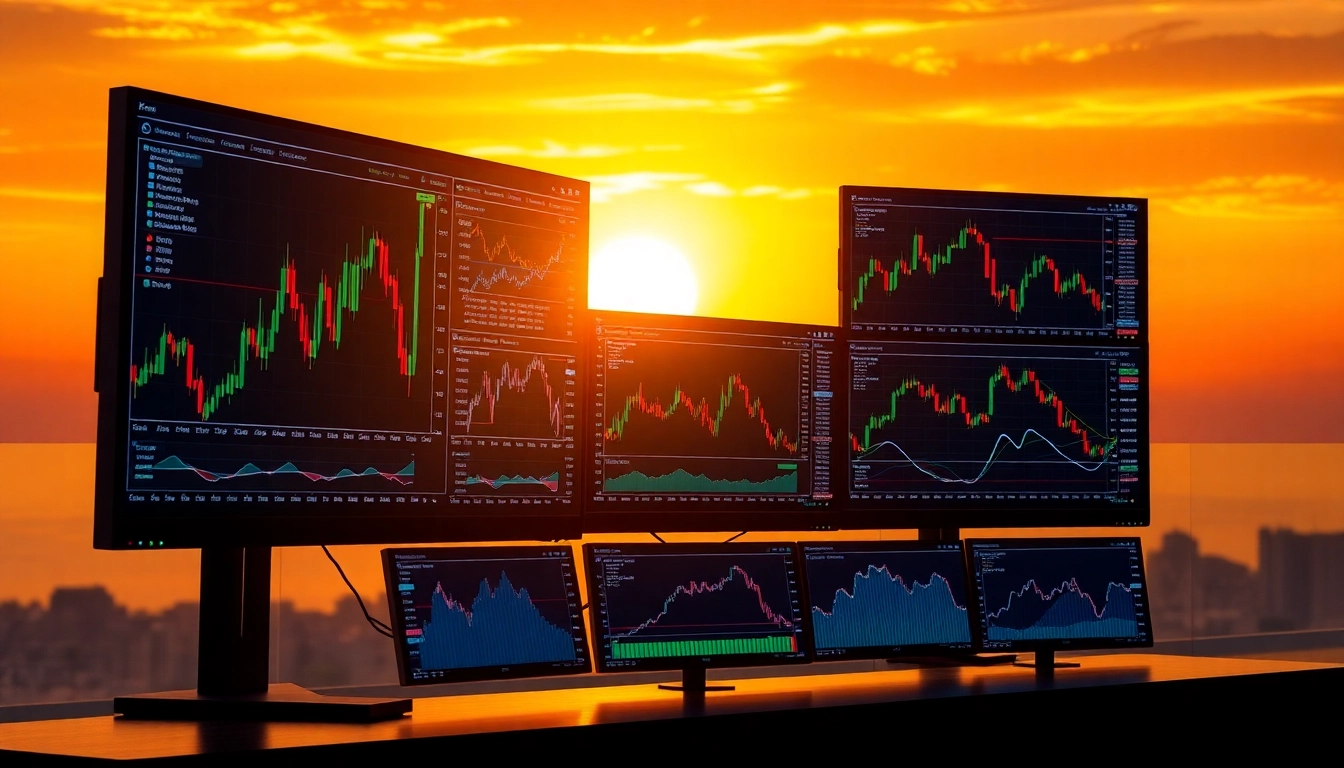
Getting started with Trading View involves creating an account that provides access to all features and customization options. Once registered, traders can craft their ideal dashboard by selecting and arranging multiple charts, widgets, and tools. An effective dashboard presents comprehensive market data at a glance, enabling traders to make swift and informed decisions. Customization options include choosing chart types (candlestick, line, bar), timeframes, and data overlays for detailed analysis.
Custom Watchlists and Alerts for Better Market Tracking
Watchlists are fundamental for monitoring assets of interest. Trading View allows users to create and organize multiple watchlists, making it easy to track stocks, cryptos, or forex pairs in one place. Alerts further enhance this functionality by notifying traders of price movements, technical indicator crossovers, or news events, facilitating timely entries and exits. Setting up alerts involves selecting specific conditions, such as when a stock hits a certain price, which helps in automating parts of the trading process and reducing reaction time.
Personalizing Indicators and Chart Layouts for Your Strategy
Personalization is key for tailored market analysis. Trading View supports hundreds of technical indicators, from simple moving averages to complex oscillators. Traders can add multiple indicators to a chart, adjust their parameters, and save custom layouts to suit different strategies. This flexibility allows traders to develop a personalized analytical environment, whether focusing on swing trading, scalping, or long-term investing.
Advanced Trading View Strategies for Market Analysis
Using Technical Indicators for Precise Entry and Exit Points
Technical indicators form the backbone of many trading strategies. Combining moving averages, RSI, MACD, Bollinger Bands, and volume analysis provides a multi-dimensional view of market conditions. For example, a trader may use the crossover of short-term and long-term moving averages to identify trend reversals or employ RSI divergences to spot potential momentum shifts. Backtesting these combinations within Trading View enables traders to refine their approaches and optimize entry and exit points with historical data.
Applying Drawing Tools and Pattern Recognition
Drawing tools like trendlines, Fibonacci retracements, and chart patterns such as head and shoulders or double bottoms empower traders to visually interpret market sentiment and anticipate future movements. Recognizing these patterns in real-time charts enhances decision-making accuracy. Trading View’s robust annotation tools allow traders to mark key levels, support and resistance zones, and breakout points for future reference, making pattern-based analysis a practical and repeatable process.
Integrating Trading View with Your Trading Platforms
For a seamless trading experience, integration between Trading View and brokerage platforms is essential. Many brokers support direct order execution from within Trading View, enabling traders to execute trades based on technical analysis without switching interfaces. This integration reduces latency and improves efficiency, especially for active traders. Setting up API connections and ensuring compatibility allows traders to automate trading strategies, enhancing precision and responsiveness in dynamic markets.
Analyzing Different Markets and Asset Classes
Stocks, Crypto, Forex, and Commodities on Trading View
Trading View’s expansive asset coverage equips traders to explore a wide array of markets. Users can analyze stocks from major exchanges like NYSE and NASDAQ, cryptocurrencies such as Bitcoin and Ethereum, currency pairs in the forex market, and commodities like gold and oil. This breadth of data fosters diversified analysis and diversification strategies, enabling traders to identify correlated market movements and hedge against risks.
Market Trends and Sentiment Analysis
Understanding market sentiment involves analyzing not just price action but also the collective behavior of traders. Trading View offers social features such as idea sharing, commentaries, and community discussions, providing insights into prevailing market biases. Additionally, sentiment indicators aggregate trader positions and social buzz, helping traders gauge bullish or bearish moods and make contrarian or consensus-based decisions accordingly.
Leveraging Community Ideas and Shared Analysis
The platform’s community hub features thousands of trading ideas, technical analyses, and market forecasts shared by fellow traders worldwide. Studying these shared analyses can offer fresh perspectives, validation of trading strategies, and a sense of market consensus. More experienced traders can also contribute their insights, establishing credibility and fostering collaborative growth within the platform.
Measuring Success and Improving Your Trading Strategy
Tracking Performance Metrics within Trading View
To evaluate the effectiveness of trading strategies, measurement and analysis of performance metrics are vital. Trading View allows traders to document trades, analyze win-loss ratios, and calculate profit/loss in real-time. This data-driven approach helps identify strengths and weaknesses, guiding adjustments to enhance overall trading discipline and profitability.
Adapting Strategies Based on Data and Visual Analysis
Successful traders embrace continuous improvement by adapting their strategies based on accumulated data and visual insights. Trading View’s extensive historical data and charting tools enable testing different approaches, optimizing indicator settings, and adjusting risk management protocols. Regular review and iteration foster a cycle of growth, essential for enduring success.
Staying Updated with Market News and Social Features
Incorporating real-time news feeds and social interactions into your analysis ensures a comprehensive understanding of market dynamics. Trading View’s news aggregator and social feeds keep traders informed about macroeconomic events, geopolitical developments, and market rumors that can influence asset prices. Staying abreast of this information helps in making timely decisions and reacting to unexpected market shifts.